Compiled by J.K. Ullrich for GEOG 560, Winter 2025, Oregon State University
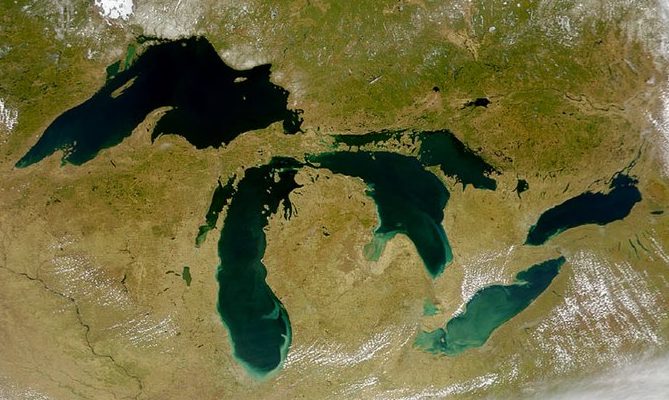
Fraught relations between the United States and Canada in 2025 raise questions about future management of their shared water sources. Negotiations on the Columbia River Treaty halted in March, leaving residents of the Great Lakes region concerned that agreements governing their local watersheds might suffer next. A geospatial understanding of these shared resources may reduce potential conflict. This annotated bibliography therefore provides resources for a GIS-based study of U.S.-Canadian transboundary watershed challenges—such as water quality, ecosystem services, and climate change—that may inform cooperative approaches to water management.
- Local landscape predictors of maximum stream temperature and thermal sensitivity in the Columbia River Basin, USA
- Tracking down pharmaceutical pollution in surface waters of the St. Lawrence River and its major tributaries
- A spatial multi-objective decision-making under uncertainty for water resources management
- Evaluating water quantity and quality of Canadian Great Lakes Watershed using LTHIA GIS Model
- Integrated measures of anthropogenic stress in the US Great Lakes basin
- Development and application of a GIS-based artificial neural network system for water quality prediction: a case study at the Lake Champlain area
- Water Supply, Demand, and Quality Indicators for Assessing the Spatial Distribution of Water Resource Vulnerability in the Columbia River Basin
- A GIS Multi-Criteria Analysis Tool for a Low-Cost, Preliminary Evaluation of Wetland Effectiveness for Nutrient Buffering at Watershed Scale: The Case Study of Grand River, Ontario, Canada
- Quantifying the spatial temporal variability of annual streamflow and meteorological changes in eastern Ontario and southwestern Quebec using wavelet analysis and GIS
- Data integration across borders; a case study of the Abbotsford-Sumas Aquifer (British Columbia/Washington State)
- Continuous Hydrologic Modeling of Snow-Affected Watersheds in the Great Lakes Basin Using HEC-HMS
- Effects of glacial retreat on proglacial streams and riparian zones in the Coast and North Cascade Mountains
- Human Influences on Water Quality in Great Lakes Coastal Wetlands
- Comparison of mercury and lead sediment concentrations in Lake Ontario (1968-1998) and Lake Erie (1971-1997/98) using a GIS-based kriging approach
- Landscape Based Agricultural Water Demand Modeling—A Tool for Water Management Decision Making in British Columbia, Canada
- GIS-based Water Quality Modeling in the Sandusky Watershed, Ohio, USA
- Using a Novel Spatial Tool to Inform Invasive Species Early Detection and Rapid Response Efforts
- Modeling the Impacts of Water Level Changes on a Great Lakes Community
Local landscape predictors of maximum stream temperature and thermal sensitivity in the Columbia River Basin, USA
Chang, H. & Psaris, M. (2013). Local landscape predictors of maximum stream temperature and thermal sensitivity in the Columbia River Basin, USA. The Science of the Total Environment, 09, 461-462, 587-60. https://www-sciencedirect-com.oregonstate.idm.oclc.org/science/article/pii/S0048969713005767
SUMMARY: This study identified how landscape factors influence the water temperature—and consequently the health—of lotic ecosystems in the Columbia River basin. Anthropogenic land alterations such as logging, mining, and agriculture can affect a stream’s “local heat budget”. Unstable water temperatures can disrupt oxygen dissolution, chemical reactivity, and fish life cycles. To explore the relationship between landscape and stream temperature, the authors mapped the basin’s geographical features like elevation and slope. Using national hydrography data sets, they calculated base flow for different channels, then added average air and stream temperatures from 74 sites. Results indicated that geographical factors heavily influenced thermal sensitivity, but catchment also contributes. The amount of forest cover also had a negative relationship with the thermal maximum, indicating that shade along riparian zones can lower the water temperature. Better understanding these complex landscape interactions may inform methods for better water management.
RELEVANCE: Since the Columbia River forms in Canada before flowing into the American Northwest, landscape changes on the northern side could have both environmental and economic ramifications across the border. For example, anadromous salmon migrate between the freshwater Columbia and the Pacific Ocean; distributed effects on their habitat could ultimately compromise food chains and the human livelihoods that rely on fish stocks. Water rights could come into play if flow diversions in Canada disrupt conditions downstream. The study’s findings offer practical insight into nature-based ecosystem maintenance through management of local landscape features. Creating microclimates in stream areas, by increasing groundwater during low-flow periods and maintaining shade vegetation could better manage salmon habitat.
Tracking down pharmaceutical pollution in surface waters of the St. Lawrence River and its major tributaries
Vaudreuil, M., Munoz, G., Vo Duy, S., & Sauvé, S. (2024). Tracking down pharmaceutical pollution in surface waters of the St. Lawrence River and its major tributaries. The Science of the Total Environment, 912, Article 168680. https://www-sciencedirect-com.oregonstate.idm.oclc.org/science/article/pii/S0048969723073084
SUMMARY: This report presented the first large-scale characterization of pharmaceuticals in the St. Lawrence River watershed. Sampling more than 700km of the river across a five-year study period, the research yielded novel insights on the spatial distribution of pharmaceutical pollutants. The authors surveyed 27 pharmaceutical agents in the St. Lawrence River watershed, ranging from antibiotics to hormones to antidepressants. They identified collection sites in the watershed and used a transect approach to sample multiple water flows with minimal mixing. After conducting chemical analysis on samples from the river and its tributaries, the researchers used a GIS to plot spatial distribution of different contaminants. Recurring clusters of contaminants supported the theory of limited mixing between adjacent water flows. Geographical mapping also evaluated the dilution effects of tides and salinity along various points of the river. However, this dilution appeared insufficient to mitigate effluent from Montreal.
RELEVANCE: The study found extremely high levels of some agents near municipal effluents from the Montreal area, less than 100km from the U.S. border. Pollution in this watershed is clearly a threat for both countries. Pharmaceutical contamination of water resources can promote dangerous antimicrobial resistance, while hormone exposure can cause adverse health effects in both humans and aquatic organisms, even at trace levels. Identifying how these contaminants distribute spatially could identify at-risk communities. As of the report’s publication, the Canadian government had no emissions regulations for pharmaceutical pollutants. The study findings may therefore support joint policy frameworks for pharmaceutical waste disposal and advanced wastewater treatment.
A spatial multi-objective decision-making under uncertainty for water resources management
Simonovic, S. & Nirupama. (2005). A spatial multi-objective decision-making under uncertainty for water resources management. Journal of Hydroinformatics. 7 (2), 117-133. https://www.proquest.com/scholarly-journals/spatial-multi-objective-decision-making-under/docview/1943106110/se-2.
SUMMARY: A new technique called Spatial Fuzzy Compromise Programming (SFCP) addressed analytic uncertainties in decision-making about water resources. Unlike conventional techniques, SFCP considers the spatial variability of criteria by comparing values for individual raster cells. To demonstrate the technique, the researchers conducted a case study on the Red River floodplain outside of Manitoba, Canada. Using remote sensing data from LIDAR, they developed a digital elevation model of the study area. Feature image datasets helped establish points of interest. Finally, hydraulic data for that area of the Red River enabled simulation of flooding scenarios. GIS software calculated potential damage and generated raster images of the outcomes. The study compared how SFCP and traditional deterministic analysis evaluated three flood-protection options—dikes, and controlled floodway shifts—based on the spatially variable criteria of water depth and flood damage. Results demonstrated that while conventional techniques are useful for recommending flood protection options for an entire region, SFCP’s ability to account for spatial variability makes it a more refined tool for evaluating specific locations within a region.
RELEVANCE: The Red River flows through Minnesota and North Dakota into Manitoba. Historical floods have caused serious damage to urban and agricultural areas in both the United States and Canada. More sophisticated, GIS-driven flood management techniques can not only help communities be more resilient, but potentially reduce conflict if anthropogenic factors on one side of the border affect flood risk on the other. The novel technique introduced in this paper appears to support more geographic specificity, making it a potentially valuable tool for local emergency managers who may lack the resources of larger regions.
Evaluating water quantity and quality of Canadian Great Lakes Watershed using LTHIA GIS Model
Paul, P., Brar, T., Daggupati, P., Rudra, R., Goyal, P. (2023). Evaluating water quantity and quality of Canadian Great Lakes Watershed using LTHIA GIS Model. Canadian Biosystems Engineering, 65(1), 1-16. https://doi-org.oregonstate.idm.oclc.org/10.7451/CBE.2023.65.1.1.
SUMMARY: This study identified variations in surface runoff and non-point source pollution associated with climate change in the Canadian Great Lakes Watershed (CGLW). It also demonstrated how the Long-Term Hydrological Impact Assessment (LTHIA) model can simulate water quality and climate-change effects. First developed as a spreadsheet to calculate runoff and pollutant loading, the original GIS version of LTHIA excluded slope factor, which limited its accuracy. Furthermore, precipitation data had to be entered through time-consuming manual joins. In this study, researchers modified the LTHIA model to incorporate slope and improved data input methods. To test it, they calculated long-term effects of runoff and pollutants in the CGLW. After adding land use and soil data, they used a digital elevation model to calculate the slope of each raster cell. The calibrated model simulated different sub-watersheds within the CGLW at decade intervals between 1950 and 2015, as well as future climate change scenarios. Results showed a positive relationship between precipitation and runoff, with expected increases in the future projections.
RELEVANCE: As climate change alters rainfall patterns, scientists will need more sophisticated tools to model interactions between precipitation, geography, and watersheds. This study’s forecast of increased pollutant runoff will likely carry phosphorus into the Great Lakes, causing algae growth and eutrophication in the drinking water source for 10% of Americans and 25% of Canadians. Spatial maps that illustrate anticipated changes in water quality variables can help watershed managers identify the highest-risk areas, prioritizing local controls on pollution and soil loss. Furthermore, visual data can emphasize the transboundary nature of such problem and encourage collaborative responses.
Integrated measures of anthropogenic stress in the US Great Lakes basin
Danz, N., Niemi, G., Regal, R., Hollenhorst, T., Johnson, L., Hanowski, J., Axler, R., Ciborowski, J., Hrabik, T., Brady, V., Kelly, J., Morrice, J., Brazner, J., Howe, R., Johnston, C., Host, G. (2007). Integrated measures of anthropogenic stress in the US Great Lakes basin. Environmental Management, 39 (5), 631-647. https://doi-org.oregonstate.idm.oclc.org/10.1007/s00267-005-0293-0
SUMMARY: While many studies focus on a single environmental stress indicator, these researchers created a GIS database encompassing five classes of anthropogenic stress in the U.S. Great Lakes basin: agriculture, atmospheric deposition, human population, land cover, and point source pollution. They used spatial data transformation techniques to convert the disparate original measurements (including points, polygons, and pixels) into a common unit. Combining datasets from 762 watershed areas produced a cumulative stress index and mapped stress patterns across the basin. That enabled associative analysis between the stress sources and different ecological elements. Tests against previously established ecological stress responses, such as water chemistry and wildlife communities, validated the index. Increased anthropogenic stress showed a strong positive correlation with ecological impairment. Results were sufficiently sensitive to identify which stressors had the greatest effect on different regions of the basin.
RELEVANCE: One of the most industrialized regions of the world, the Great Lakes basin is subject to a plethora of human influence. it contains about 10% of the U.S. population and 30% of the Canadian population; additionally, its landscapes support about 7% of America’s agricultural production and nearly 25% of Canada’s. A holistic view of anthropogenic ecosystem variables, as explored in this study, is therefore critical to managing this heavily exploited region. Furthermore, the interaction of multiple stressors can create more complex scenarios that might not be apparent in more focused analyses. Quantifying the spatial pattern of stress across a region can help characterize the relationship between humans and the environment, and prioritize areas in need of sustainable management.
Development and application of a GIS-based artificial neural network system for water quality prediction: a case study at the Lake Champlain area
Lu, F., Zhang, H., Liu, W. (2020.) Development and application of a GIS-based artificial neural network system for water quality prediction: a case study at the Lake Champlain area. Journal of Oceanology and Limnology, 38 (6), 1835-1845. https://doi.org/10.1007/s00343-019-9174-x.
SUMMARY: Observing that previous uses of artificial neural networks (ANNs) for water quality prediction used pre-trained models that couldn’t be changed, researchers integrated an ArcGIS engine to create a more user-friendly application and generate spatial distribution maps of results. These revisions made the tool more accessible for environmental managers who may not possess high-level programming skills. The researchers used Lake Champlain—which had experienced harmful algae blooms due to phosphorus pollution—as a case study. Training data included water chemistry data and tributary flow rate data to calculate phosphorus loading from tributaries. The ArcGIS engine rendered visual representation of the model’s output. The predicted distribution of phosphorus concentrations generally matched monitored values, indicating that the tool could produce reliable results.
RELEVANCE: Lake Champlain, located between Quebec and the U.S. states of Vermont and New York, has suffered significant phosphorous pollution. Water quality modeling is therefore critical for the health of both the lake and the surrounding communities. Sophisticated methods used in scientific research may not always be suitable for local planners, especially if pre-trained models do not allow for adjustment under new conditions. This study’s user-friendly alternative, with graphical output suitable for presentation to decision-makers, could provide a valuable tool for water conservation. Additionally, it may enable managers on both sides of the border to more readily collaborate on projections, improving shared awareness of the ecosystem’s status.
Water Supply, Demand, and Quality Indicators for Assessing the Spatial Distribution of Water Resource Vulnerability in the Columbia River Basin
Chang, H., Jung, I., Strecker, Angela., Wise, D., Lafrenz, M., Shandas, V., Moradkhani, H., Yeakley, A., Pan, Y., Bean, R., Johnson, G., Psaris, M. (2013). Water Supply, Demand, and Quality Indicators for Assessing the Spatial Distribution of Water Resource Vulnerability in the Columbia River Basin.
Atmosphere-Ocean, 51 (4), 339-356. https://doi.org/10.1080/07055900.2013.777896
SUMMARY: This study examined indicators of water supply, demand, and quality to determine spatial patterns of water vulnerability in the U.S. Columbia River basin (CRB). Researchers calculated a vulnerability index for each indicator based on multiple compositional factors, producing a regional map of severity. Local indicators of spatial autocorrelation (LISA) statistics, available in spatial analysis software, identified spatial clustering of counties for all three vulnerability indices. However, causes varied between counties. For example, high vulnerability in one county was linked to frequent rainless days and heavy irrigation areas, while another came from heavy precipitation and urban density. Plotting the vulnerability indices against the three major controls revealed that supply vulnerability increased with demand vulnerability, but neither had a consistent relationship with water quality. The authors concluded that decisions about land use played a larger role in water quality vulnerability than any biophysical or climate factors in the CRB.
RELEVANCE: Although the CRB is an important resource for five U.S. states and one Canadian province, this study represents one of the first comprehensive assessments of its vulnerability conditions. Climate change and human activity—from settlement and agriculture to fisheries and hydropower generation—will likely increase CRB water demand in the near future. Variance in spatial vulnerability patterns across county and state lines indicated that water supply, demand, and quality were largely determined by local policies. Understanding those controls can inform better management of shared resources and potentially avoid conflict. Additionally, this study emphasizes a need for more data capture across the broader CRB: it focused on the U.S. portion of the basin because insufficient data were available on a consistent scale in the Canadian portion of the basin. Accurate data is an essential element of sustainable transboundary water management.
A GIS Multi-Criteria Analysis Tool for a Low-Cost, Preliminary Evaluation of Wetland Effectiveness for Nutrient Buffering at Watershed Scale: The Case Study of Grand River, Ontario, Canada
Alamanos, A., Papaioannou, G. (2020). A GIS Multi-Criteria Analysis Tool for a Low-Cost, Preliminary Evaluation of Wetland Effectiveness for Nutrient Buffering at Watershed Scale: The Case Study of Grand River, Ontario, Canada. Water, 12 (11), Article 3134. http://dx.doi.org.oregonstate.idm.oclc.org/10.3390/w12113134
SUMMARY: Wetland buffers provide natural filters for toxic runoff entering the Great Lakes; however, unlike a wastewater treatment plant, a wetland’s purification performance cannot be easily quantified. This study introduced a technique to address that gap and tested it on Canada’s Grand River watershed, an intensely farmed region that has lost nearly 70% of its historical wetlands. The novel approach combined GIS with multi-criteria analysis (MCA) of factors like land use, soil type, temperature, and topographic wetness. Researchers obtained raster files for these criteria, converted them to a consistent scored scale, and normalized their spatial distribution to detect wetland areas. Weighting and classifying the criteria enabled a display of values on a choropleth map. Results generally matched actual phosphorus concentrations, corroborating that areas with more effective wetlands had lower phosphorus pollution.
RELEVANCE: These findings reinforce the importance of wetlands in the hydrologic cycle, giving planners new insight into environmental services. Areas with a high concentration of wetlands could preserve or even restore those biomes to reduce water pollution. In regions with less wetland potential, changes to agricultural practices might prove more effective. Approachable evaluation tools like this can empower policymakers to consider nature-based water management strategies. Although the study focused on a Canadian watershed, the principles would likely apply across the Great Lakes region. More informed wetland management on both sides of the border would improve lake health for all North Americans.
Quantifying the spatial temporal variability of annual streamflow and meteorological changes in eastern Ontario and southwestern Quebec using wavelet analysis and GIS
Adamowski, J., Adamowski, K., Prokoph, A. (2013). Quantifying the spatial temporal variability of annual streamflow and meteorological changes in eastern Ontario and southwestern Quebec using wavelet analysis and GIS. Journal of Hydrology, 499, 27-40. https://doi.org/10.1016/j.jhydrol.2013.06.029.
SUMMARY: This study combined spatial and time-series analysis to assess streamflow amplitude in southeastern Canada across a 24-year period. Researchers normalized streamflow data, conducted wavelet analysis to detect shifts over time, and produced a gradient map for temperature and precipitation in four-year intervals. Hydrological parameters were plotted and color-coded based on amplitude and shift. While the normalized data agreed across records, phase shifts revealed a general increase in amplitude. Trends showed that spring floods occurred earlier at all hydrological stations. Temperature data revealed a warming trend in all locations, with a pronounced influence from urban heat islands, which decreased local streamflow. The U.S. border region experienced temperature increases up to 0.05°C/year and decreased precipitation by 0.5 mm/month. These results demonstrate the effects of climate change and urban development on local water resources.
RELEVANCE: Understanding the relationship between climate and regional hydrology is critical to manage water resources on a changing planet. Southern Canada warmed an estimated 0.5 and 1.5°C through the 20th century due to anthropogenic activity, while a large decrease in British Columbia’s annual mean streamflow correlates with higher spring temperatures. Flood season shifts revealed in this study alter both the threat window for natural disasters and the availability of water for uses such as irrigation. Geospatial analysis can provide the advance insights communities need to plan for such fluctuations. The researchers also highlighted how data limitations restricted their study: Canadian budget cuts in the 1990s made the necessary spatial data unavailable after 1992. Funding the collection and curation of GIS data will be critical to analyzing the effects of climate change.
Data integration across borders; a case study of the Abbotsford-Sumas Aquifer (British Columbia/Washington State)
Schuurman, N., Deshpande, A., Allen, D. (2008). Data integration across borders; a case study of the Abbotsford-Sumas Aquifer (British Columbia/Washington State). Journal of the American Water Resources Association, 44 (4), 921-934. https://www.proquest.com/scholarly-journals/data-integration-across-borders-case-study/docview/201356468/se-2
SUMMARY: While ground water models exist for both the Canadian and U.S. areas of transboundary Abbotsford-Sumas Aquifer, this study discovered that few data sets were interoperable, highlighting the challenges of multi-source dataset integration across national borders. Just acquiring datasets posed political and organizational obstacles: British Columbia’s soil and geology data were available on paper, while Washington State’s were digital. Metadata took different forms or was missing entirely. Researchers corrected numerous errors that would have compromised GIS analysis. Inconsistent database structures and attribute schemas required renaming and merging. The two countries’ datasets used different transfer formats and Spatial Reference Systems, which the researchers had to convert to a standard ESRI format. Data cleaning was time-consuming, and there was no established framework to reconcile data conflicts. The study concluded that data integration is a major impediment to cross-border studies, and suggested two standardization systems for improvement.
RELEVANCE: The Abbotsford-Sumas Aquifer is a potential source of international conflict. Canada has concerns about excessive water withdrawal south of the border, while the U.S. worries about nitrate contamination from its northern neighbor. Successful aquifer management requires data from multiple jurisdictions. Yet the data must be integrated before any meaningful analysis or decision-making can occur. Sophisticated tools for interoperability are seldom accessible for agencies with limited budgets, and may not be suitable for non-technical planners. Standardizing data from the outset makes it more readily usable. As this study demonstrates, integrated datasets are critical to transboundary resource management. Environmental phenomena do not follow geopolitical boundaries, nor should the information that characterizes them.
Continuous Hydrologic Modeling of Snow-Affected Watersheds in the Great Lakes Basin Using HEC-HMS
Gyawali, R., Watkins, D. (2013). Continuous Hydrologic Modeling of Snow-Affected Watersheds in the Great Lakes Basin Using HEC-HMS. Journal of Hydrologic Engineering, 8 (1), 29-39. https://doi-org.oregonstate.idm.oclc.org/10.1061/(ASCE)HE.1943-5584.000059
SUMMARY: Building on advances in remote surveillance techniques that enriched geospatial databases, this study explores a continuous modeling approach for watersheds linked to snowmelt. It applied the Hydrologic Engineering Center’s Hydrologic Modeling System (HEC-HMS)—which analyzes soil moisture, snow accumulation, and snow melt to describe hydrological patterns—to three Great Lakes watersheds. The authors used Theissen polygons to compute average precipitation across the regions. They set soil moisture parameters across the study area, weighting textural properties of clay, silt, and sand. Additional calibrations included variables like evaporation and melt rates. The resultant hydrographs projected where precipitation would fall as rain versus snow based on a temperature index. Compared against actual snowmelt hydrographs, HEC-HMS captured low flows well, but often underestimated winter and early spring peak flows. The researchers could not attribute these discrepancies to systemic errors in the model, suggesting that unexpected variations in climate change may prove difficult to simulate.
RELEVANCE: Snowmelt contributes significantly to the Great Lakes’ water supply, so accurate modeling of those hydrologic factors is an important part of regional water management. This study presents troubling evidence of how climate change creates unpredictable conditions that can confound statistical models. Although HEC-HMS performed well overall, it struggled to predict flow during parts of the seasons when the landscape was historically frozen. Rapid shifts in climate could leave communities unprepared for rapidly changing conditions that affect transboundary watersheds. Clearly, enhanced data collection alone is not enough to extrapolate future water scenarios. Furthermore, these findings emphasize that distant parts of a watershed—such as glaciers and snowmelt—cannot be overlooked when managing immediate water sources.
Effects of glacial retreat on proglacial streams and riparian zones in the Coast and North Cascade Mountains
Cowie, N., Moore, R., Hassan, M. (2014). Effects of glacial retreat on proglacial streams and riparian zones in the Coast and North Cascade Mountains. Earth Surface Processes and Landforms, 39 (3), 351-365. https://doi-org.oregonstate.idm.oclc.org/10.1002/esp.3453
SUMMARY: With glacier loss affecting streams in British Columbia and Washington, this study examined the development of riparian forest in those catchments and their suitability for fish habitat. Combining field survey data and GIS-based topographic analysis, researchers created create digital elevation models of each channel within 32 catchments. After identifying variables that influence riparian forest development, they classified the presence of functional forests and found long delays in forest growth along recently deglaciated channels. Digitized stream networks from contour maps, correlated with temperature data, identified habitat suitable for different species of fish across the region. Results indicated that continued glacier decline will temporarily increase habitat for cold-water fish; however, even precluding other climate change effects, glacier loss will eventually increase average stream temperatures and reduce depths. This will force cold-water fish upstream and reduce the total available habitat.
RELEVANCE: North Cascade glaciers release approximately 230 billion gallons of water each summer that humans use for agriculture, fisheries, and hydropower. Yet according to the U.S. National Parks Service, glacier extents in the North Cascades declined 20% between 1982 and 2015. This study offers a glimpse into a few environmental consequences of glacial loss. Fish have significant economic and ecological importance in the Pacific Northwest; if glacier loss compromises their habitat, it creates a potential conflict point across basin boundaries. Improving our ability to predict changes to these ecosystems can inform mitigation strategies and contribute to public education about the importance of glacier preservation through broader climate action.
Human Influences on Water Quality in Great Lakes Coastal Wetlands
Morrice, J. A., Danz, N. P., Regal, R. R., Kelly, J. R., Niemi, G. J., Reavie, E. D., Hollenhorst, T., Axler, R. P., Trebitz, A. S., Cotter, A. M., & Peterson, G. S. (2008). Human Influences on Water Quality in Great Lakes Coastal Wetlands. Environmental Management, 41(3), 347-57. https://doi.org/10.1007/s00267-007-9055-5
SUMMARY: This study evaluated how various anthropogenic activities affected water quality in coastal wetlands of the Great Lakes basin. Researchers used a GIS to develop metrics for different stressors such as agricultural practices, human population distribution, point source pollution, and atmospheric deposition. Analyzing these data with water chemistry from 98 wetlands along the United States shoreline of the Laurentian Great Lakes revealed relationships between stressors and water quality. Results showed that all types of stress influenced water quality. Agriculture and point source pollution emerged as primary drivers, while human population and atmospheric deposition explained variance in several water quality parameters. Differences in wetland morphology and biogeography did not improve predictive models.
RELEVANCE: The findings reinforce the association between the health of Great Lakes coastal ecosystems and surrounding land use practices. Agriculture plays a particularly influential role, reshaping local topography and often introducing heavy chemicals into the watershed. Although wetlands provide some natural water filtration buffers, as demonstrated in other studies, no type of wetland is invulnerable to impairment from human activity. Understanding these relationships is essential to sustainable approaches, which must be implemented on both sides of the border to steward this transboundary water source.
Comparison of mercury and lead sediment concentrations in Lake Ontario (1968-1998) and Lake Erie (1971-1997/98) using a GIS-based kriging approach
Forsythe, K., Dennis, M., Marvin, C. (2004). Comparison of mercury and lead sediment concentrations in Lake Ontario (1968-1998) and Lake Erie (1971-1997/98) using a GIS-based kriging approach.
Water Quality Research Journal of Canada, 39(3), 190-206. https://doi.org/10.2166/wqrj.2004.028
SUMMARY: This study compared concentrations of heavy metals in two Great Lakes at either end of a multi-decade period. Sediment samples taken from lakes Ontario and Erie in 1968 and 1971 respectively were compared against samples from the late 1990s. Rather than rely on default methods of interpolating sample point data, which did not entirely cover the lake area, researchers used kriging to generate models of each lake in different collection years. Results for 1971 indicated that Lake Erie’s mercury originated mainly from Detroit and Cleveland. Lake current circulation patterns and bathymetry influenced the concentration distribution. More recent data showed less definitive gradients in these areas and significant reductions in sediment concentrations, suggesting positive results of the $130 million Detroit River remediation efforts between 1993 and 2001.
RELEVANCE: Environmental GIS analysis needn’t always predict negative outcomes! Here, it quantifies improvements to an ecosystem across space and time. By mapping the main sources of pollution, and adding the temporal dimension to track changes through the years, this study demonstrates the success of water cleanup efforts. The kriging approach showcased an alternative to more traditional interpolation methods, providing valuable comparative analysis. In a transboundary watershed, this technique could help identify the locus of pollution and the party responsible for its management. It can also illustrate the wide-ranging effects of point source contamination, compelling stakeholders across the watershed to take part in solutions.
Landscape Based Agricultural Water Demand Modeling—A Tool for Water Management Decision Making in British Columbia, Canada
Neilsen, D., Bakker, M., Van der Gulik, T., Smith, S., Cannon, A., Losso, I., & Anna, W. S. (2018). Landscape Based Agricultural Water Demand Modeling—A Tool for Water Management Decision Making in British Columbia, Canada. Frontiers in Environmental Science, https://doi.org/10.3389/fenvs.2018.00074
SUMMARY: Climate change threatens to alter water supply and demand in British Columbia, where limited arable land competes with urban development for water resources. To help assess these needs, this study developed a GIS-based water demand model for agricultural water use. The model comprised layers for land use, soils, sub-basins, aquifers, and a digital elevation model. Atop this structure, the researchers gridded temperature and precipitation data for both historical and future climate-change scenarios. They applied the model to two case studies: changes in water use under climate change and agricultural expansion; and the effect of crop production on irrigation demand in the Okanagan region. Results indicated that climate change would likely increase irrigation demand between 20-40% depending on the emissions scenario. Although the researchers made statistical allowance for uncertainty, they cautioned that uncertainty will increase as the climate deviates from historical norms.
RELEVANCE: Increasing stress on British Columbia’s water resources—such as the seasonal droughts in 2003, 2009, 2015, and 2017—will not stay contained within Canadian borders. Reduction in flow and increase in demand will inevitably affect water availability downstream in the U.S., creating conditions for conflict. Modeling potential resource changes now can help anticipate shortfalls and establish mitigation measures. For example, agriculture accounts for 70% of water consumption in some parts of the study region: adopting more efficient irrigation systems or less water-intensive crops could make the industry more resilient. The study also reinforces how statistical models may struggle with the uncertainties of climate change.
GIS-based Water Quality Modeling in the Sandusky Watershed, Ohio, USA
Grunwald, S., & Qi, C. (2006). GIS-Based Water Quality Modeling in the Sandusky Watershed, Ohio, USA. Journal of the American Water Resources Association, 42(4), 957. https://oregonstate.idm.oclc.org/login?url=https://www.proquest.com/scholarly-journals/gis-based-water-quality-modeling-sandusky/docview/14797259/se-2
SUMMARY: Previous research on the Sandusky watershed’s contamination of Lake Erie provided a composite number for the entire watershed; instead, this study sought to track pollution transport throughout and identify non-point sources. To accomplish this, the authors employed the Soil and Water Assessment Tool (SWAT), a model that simulates the hydrological cycle to assess water, sediment, and chemical transport in large watersheds. The model parameters evaluated suspended sediment, phosphorus, and nitrogen in two of Sandusky’s sub-watersheds. Researchers mapped these areas using a 30m digital elevation model enriched with data sets on hydrography, meteorology, soil, climate, and land and water use. They delineated hydrological response units within the watershed to create separate simulation elements and incorporated 23 major point pollution sources. Visualizing the data as color-coded maps illustrated the monthly pollutant yield in different areas. Results generally agreed with observed patterns; however, water quality simulations showed unexpectedly high degrees of uncertainty. This could be due to limited information on watershed characteristics or a need for higher-quality data.
RELEVANCE: The moderate to high uncertainty in this study’s results highlights the importance of data quality in environmental modeling. Although GIS methodologies enabled creation of a detailed geographical model, that alone could not generate accurate output about spatial distribution. The authors acknowledged that lack of land-use information limited their work, forcing them to rely on generic extension datasets for Ohio. This could be doubly challenging when working on U.S.-Canada transnational watersheds. Compromised data quality on either side could produce inaccurate results, misinforming decisions and setting conditions for conflict. Additionally, the study’s inspiration points out a methodological weakness with serious implications for transboundary watersheds. An overly broad scope—such as generalizing contaminants from an entire watershed rather than pursuing more detailed geospatial insights—risks overlooking specific sources of problems in areas with overlapping jurisdiction.
Using a Novel Spatial Tool to Inform Invasive Species Early Detection and Rapid Response Efforts
Davidson, A. D., Fusaro, A. J., & Kashian, D. R. (2015). Using a Novel Spatial Tool to Inform Invasive Species Early Detection and Rapid Response Efforts. Environmental Management, 56(1), 54-65. https://doi.org/10.1007/s00267-015-0484-2
SUMMARY: Since management of invasive species requires early detection and rapid response, the authors developed a mapping tool that can identify potential spread of organisms via recreational boating. They tested the capability in the Great Lakes watershed. After surveying boaters about their routes and behaviors associated with species transfer (such as insufficient boat cleaning or not removing organic material from boat trailers), they mapped high-risk areas. Results identified the waterways with the most boater-based connections that could introduce invasive species. However, outcomes differed based on whether the researchers included boater behavior or just travel patterns. This enables a social as well as geospatial assessment of how invasive species might spread throughout the watershed.
RELEVANCE: According to the National Oceanic and Atmospheric Administration, at least 180 invasive species such as the zebra mussel and sea lamprey have damaged the Great Lakes’ native ecosystems. Alliance for the Great Lakes reports that 65% percent of these species entered the biome when ships dumped their ballast water. GIS approaches can help assess the risks associated with maritime activity in the watershed, providing a transboundary assessment of threat patterns. Tracking boat routes between Canada and the U.S. may identify opportunities for joint policy development, such as consistent requirements for boat cleaning between bodies of water. This study also demonstrates how GIS can reveal new perspectives on economic and social behavior within geographic space—for example, highlighting high-risk behavior hotspots that could benefit from focused public awareness messaging. Understanding how people interact with their water systems may help avoid transboundary water conflict.
Modeling the Impacts of Water Level Changes on a Great Lakes Community
Schwartz, R. C., Deadman, P. J., Scott, D. J., & Mortsch, L. D. (2004). Modeling the Impacts of Water Level Changes on a Great Lakes Community. Journal of the American Water Resources Association, 40(3), 647. https://oregonstate.idm.oclc.org/login?url=https://www.proquest.com/scholarly-journals/modeling-impacts-water-level-changes-on-great/docview/14705220/se-2
SUMMARY: The authors present a GIS-based method to assesses how declining water levels from climate change will affect Great Lakes waterfront communities. Goderich, Ontario on Lake Huron served as a case study. Researchers combined topographic and bathymetric datasets into a triangulated irregular network (TIN) of the study area. Additional TINs modeled projected shoreline changes under different water-level scenarios for the year 2050. Depending on the scenario, the shoreline moved between 0.46-142.69 meters offshore, exposing up to 74,635 square meters of lake bed. Mapping these results provided insight into how climate change would affect the community’s land use, shoreline development, and sediment transport processes. For example, reduced water level would require dredging of the lake bottom to maintain seaway depth. The model was designed for easy update by different communities, or as more confident climate-change forecasts became available.
RELEVANCE: Geographical models of how climate change may affect the Great Lakes’ water levels may help leaders craft better long-term policies and prepare resilient communities. Since climate change transcends geopolitical borders, it is also important to understand effects on both Canadian and American communities. Anticipating those futures may forestall potential conflict and identify joint solutions. For example, both nations may suffer if compromised seaway depth limits commercial shipping, and border towns may find collaboration opportunities that help North American communities adapt to the new landscape together.
